The PitchGrid Spiky Consonance Measure
1. Introduction
The question of why certain musical intervals sound consonant has occupied theorists for millennia. While classical accounts emphasize small-integer frequency ratios (Pythagoras, Euler, Helmholtz), the landmark work of Plomp and Levelt (1965) demonstrated that consonance has a strong sensory component: pairs of pure tones produce roughness (dissonance) when their frequency difference falls within a critical bandwidth of the auditory system.
Sethares (1993, 2005) extended this insight to complex tones, showing that the consonance of an interval depends not only on the frequency ratio but also on the timbre — the spectrum of partials — of the tones involved. His parametric model of the Plomp-Levelt curve enabled computation of aggregate dissonance for arbitrary spectra, revealing that the familiar consonances of Western music emerge naturally from harmonic spectra, while inharmonic timbres (bells, metallophones) favor entirely different interval structures. Sethares also demonstrated the converse: given any scale, one can construct a timbre whose partials align with the scale's intervals, making that scale sound consonant.
However, Sethares' dissonance curve — while foundational — has an inherent limitation: it measures absolute roughness, not relative consonance. The dissonance minima that indicate consonant intervals sit in valleys of varying depth and width, on a baseline that shifts with register and timbre. Comparing the "consonance" of a fifth against a major third, or across different tuning systems, requires visual inspection rather than quantitative comparison. No prior work has extracted a clean, normalized consonance measure from the Sethares dissonance curve.
In this article, we introduce the PitchGrid Spiky Consonance Measure — a novel post-processing pipeline built on a technique we call hull extraction. We fit a smooth envelope (hull) to the dissonance curve and define consonance as the residual between the hull and the curve itself. This transforms consonance from "how low is the dissonance?" to "how far does the dissonance drop below its local spectral baseline?" — a relative measure that naturally adapts to different timbres and registers. After normalization and logarithmic scaling, the measure maps any interval to a 0–1 scale, enabling quantitative comparison across tuning systems, timbres, and scale structures.
We validate the measure across six tuning systems — including non-diatonic MOS (Moments of Symmetry) scales such as Porcupine[8] and Slendric[11] — bridging Erv Wilson's structural scale theory with Sethares' psychoacoustic framework. We further introduce reverse tuning: the systematic construction of pseudoharmonic timbres matched to a given scale, and demonstrate that reverse-tuned 12-TET achieves higher mean consonance than quarter-comma meantone with harmonic timbre — a result with implications for electronic music production and instrument design.
2. Method
2.1 Interval Naming Convention
Throughout this article, we use a zero-based interval naming convention designed to generalize naturally to any MOS (Moment of Symmetry) scale. In this system:
- P0 = unison, P7 = octave (for 7-note diatonic scales)
- Intervals that come in two sizes across modes are labeled mX (minor) and MX (Major) — e.g., m2 = minor third, M2 = major third in diatonic
- We deliberately avoid the traditional labels "perfect fourth" (P4) and "perfect fifth" (P5). In our notation these are m3 and M4 respectively, because the concept of "perfection" for 4ths and 5ths does not generalize to non-diatonic MOS scales where different step counts may be "perfect"
- This notation extends naturally: a Bohlen-Pierce scale uses P0–P9, Porcupine[8] uses P0–P8, and Slendric[11] uses P0–P11, each with their own minor/Major interval pairs
For readability, conventional names are given in parentheses where they first appear.
2.2 Plomp-Levelt Dissonance Curve
Given a timbre defined by a set of partials with frequencies f1, f2, …, fN and corresponding amplitudes a1, a2, …, aN, we compute the sensory dissonance between two complex tones separated by an interval x (in cents). For each pair of partials (i from tone 1, j from tone 2), the pairwise dissonance is given by Sethares' parametrization of the Plomp-Levelt curve:
where s = d* / (S1 · fmin + S2), with constants:
The total dissonance at interval x is the sum over all inter-tone partial pairs:
2.3 The Hull Curve (Hull₃)
The dissonance curve D(x) contains sharp valleys at consonant intervals, but these sit on a varying baseline. To extract the consonance information, we construct a hull curve that traces the "shoulders" of the dissonance function — the smooth upper envelope from which consonance valleys descend.
The procedure is:
- Compute the second derivative D″(x) of the dissonance curve (numerically).
- Identify local maxima of D″(x), excluding singular spikes where D″ ≤ 0.005 (these correspond to the sharp tips of dissonance peaks, not the shoulder structure we seek).
- Construct a cubic spline interpolation through these shoulder points.
- Clamp: ensure the hull is everywhere ≥ D(x), so it forms a true upper bound.
We denote this the Hull₃ curve (cubic spline through second-derivative maxima). The subscript distinguishes it from simpler hull constructions (e.g., linear interpolation or convex hull), which proved less effective at capturing the musically relevant shoulder structure.
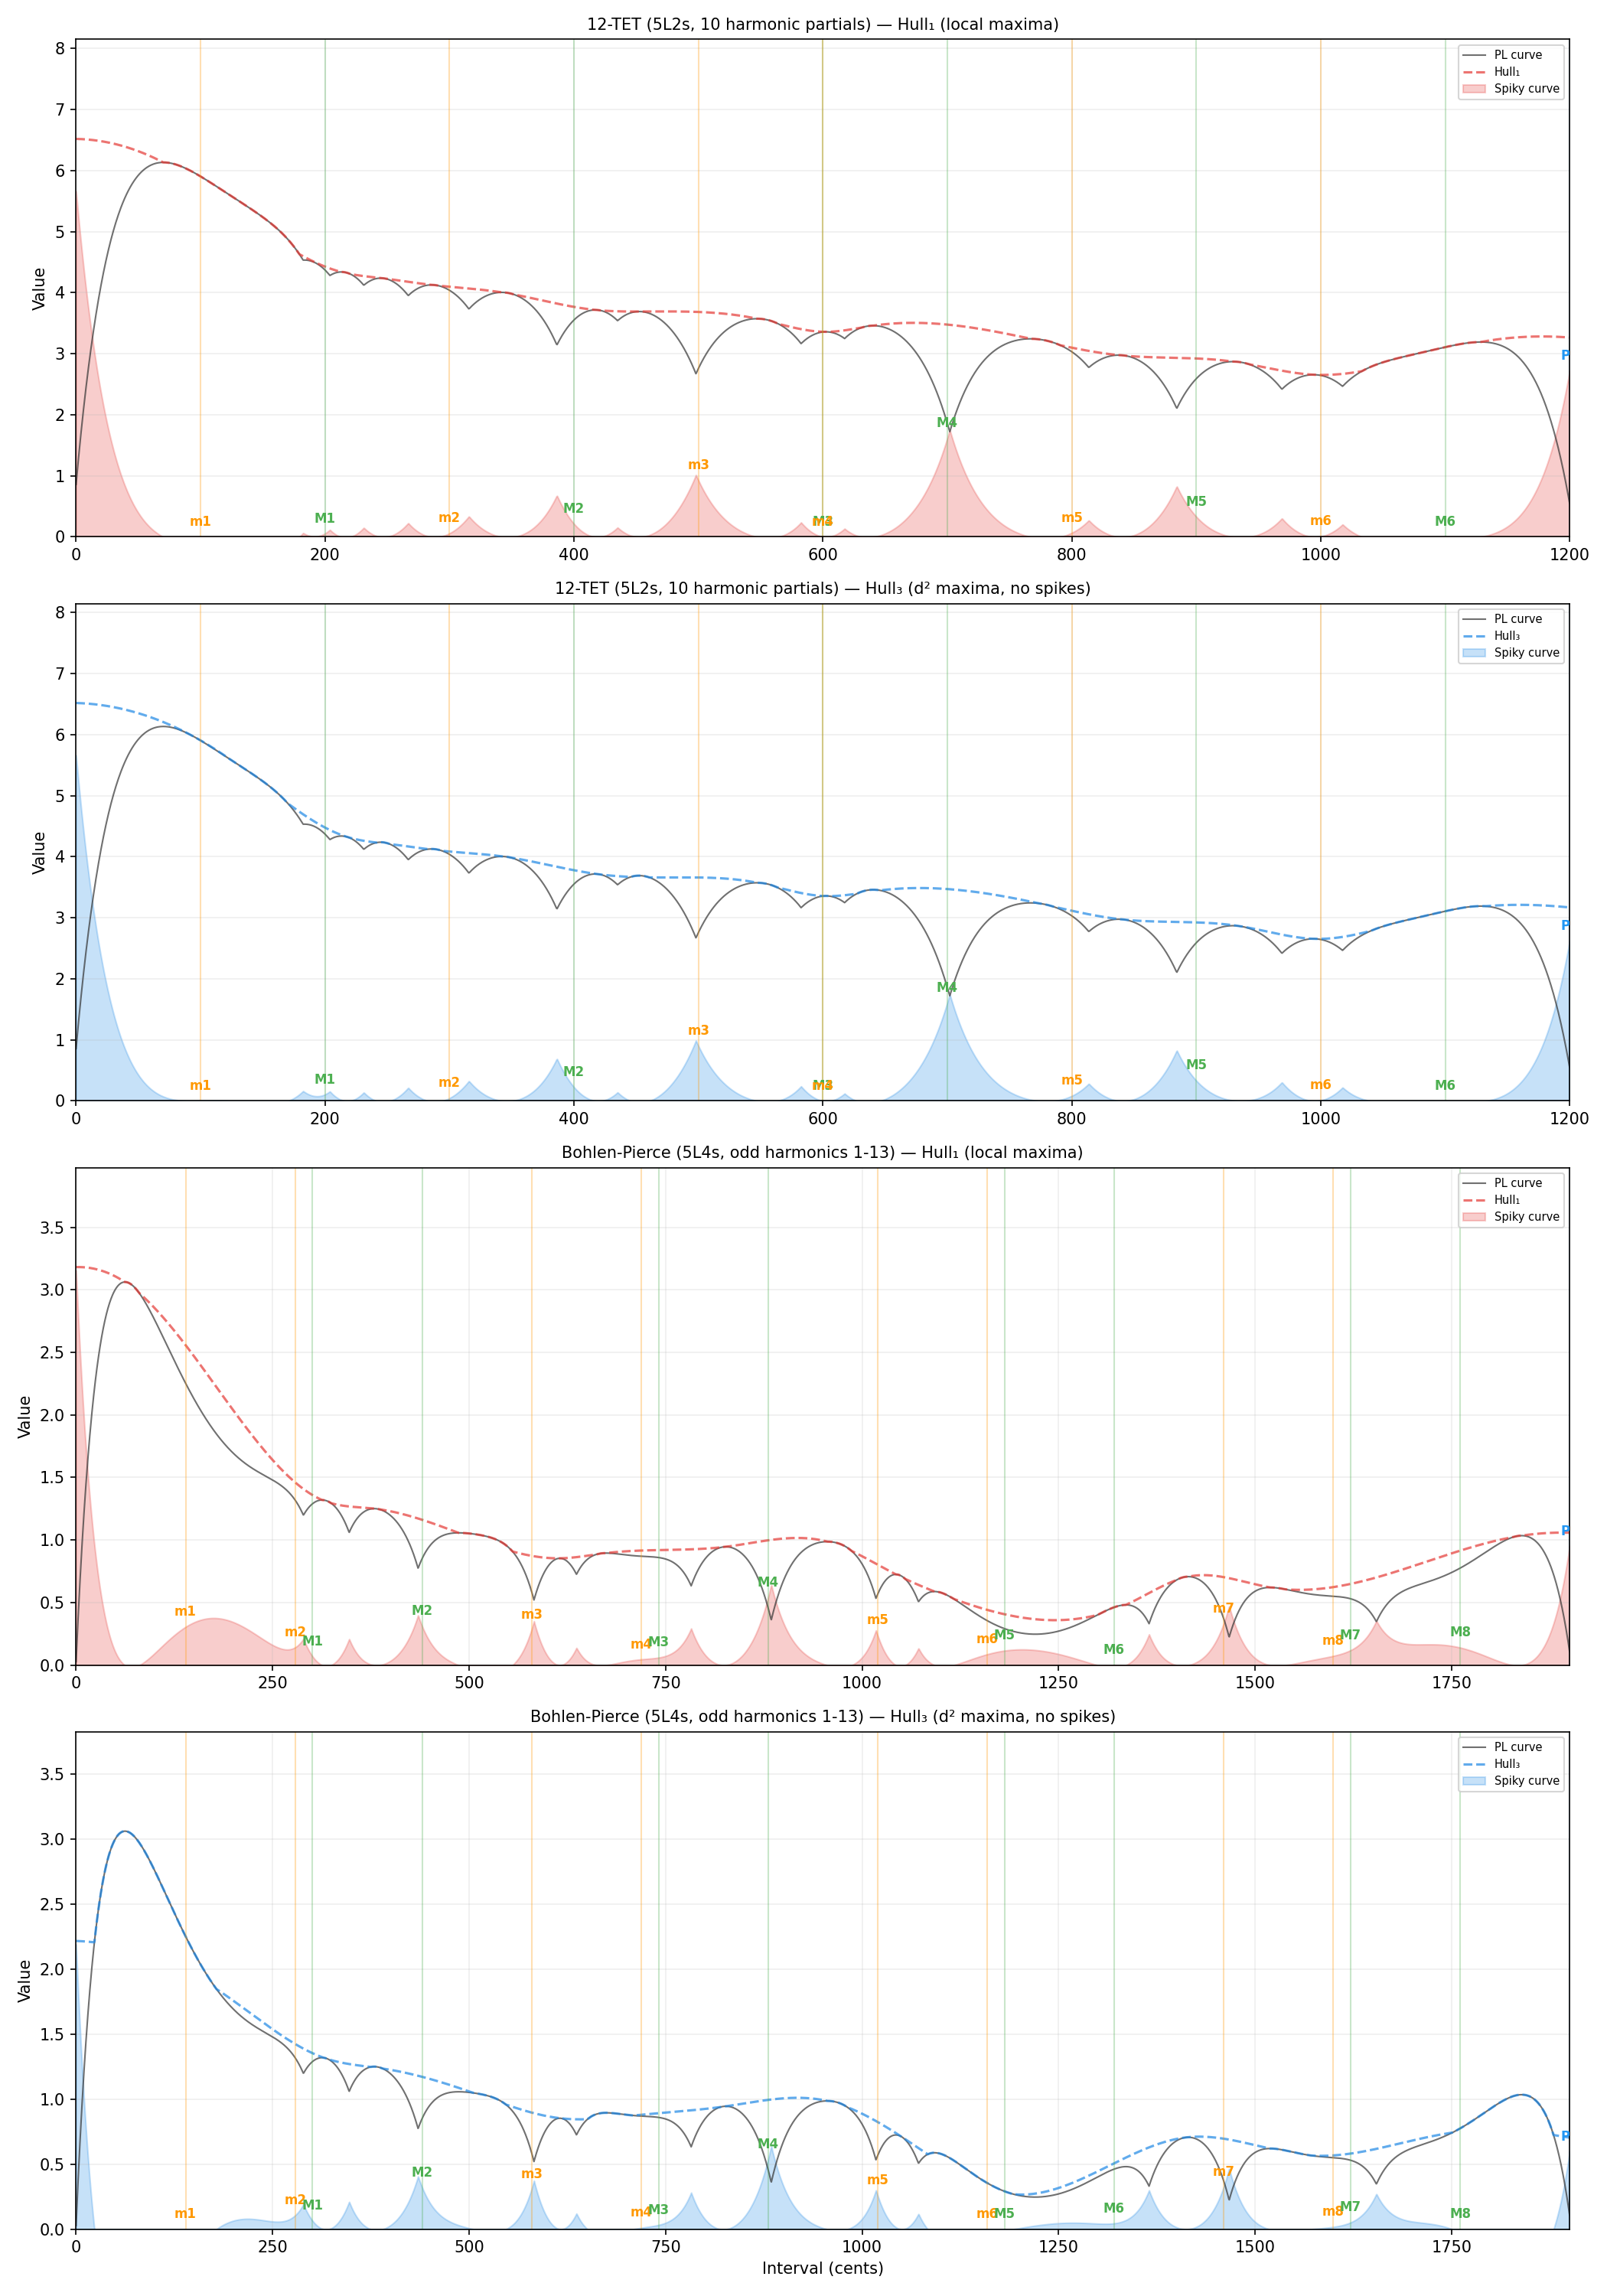
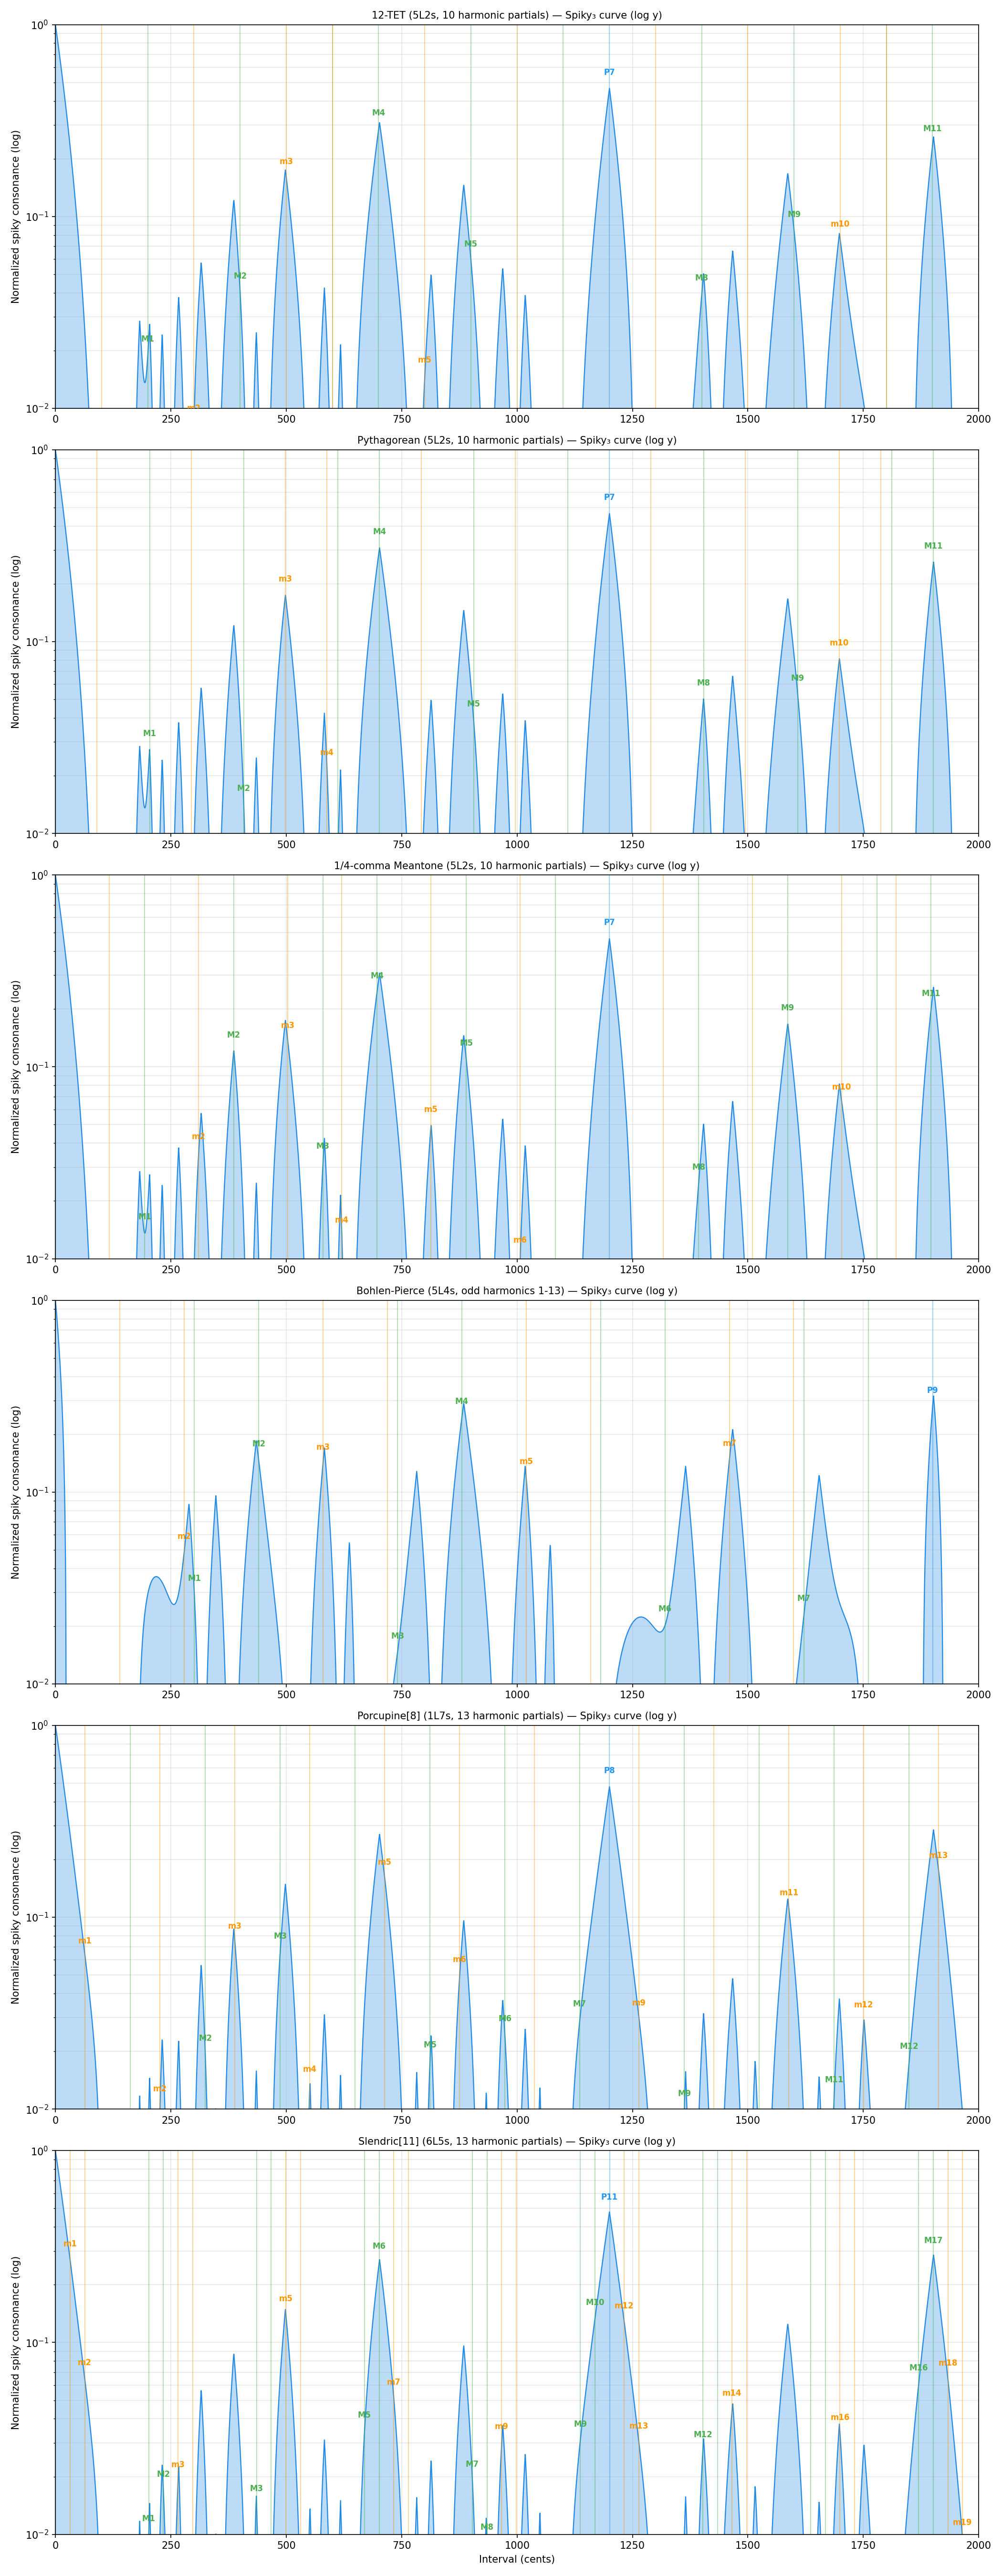
2.4 The Spiky Consonance Curve
The spiky consonance curve is defined as the residual:
This curve is non-negative by construction (since the hull is clamped to be ≥ D) and exhibits sharp peaks at consonant intervals — where the dissonance curve dips furthest below the shoulder envelope. The name "spiky" reflects the characteristic sharp, narrow peaks at consonant ratios.
2.5 Normalization
We normalize the spiky curve by dividing by its value at unison (0 cents):
so that unison always has normalized spiky value 1.
2.6 The PitchGrid Consonance Measure
Finally, we apply a logarithmic scaling to map the normalized spiky values to a perceptually meaningful range:
This yields a consonance measure with the following properties:
- Range 0–1: Unison maps to 1, intervals with normalized spiky values below 0.01 map to 0.
- Logarithmic perception: The log scaling mirrors the approximately logarithmic nature of perceptual judgments (Weber-Fechner law), compressing large differences at the consonant end and expanding small differences at the dissonant end.
- Timbre-dependent: Because the entire pipeline starts from the spectrum of partials, the consonance measure inherently depends on both the interval and the timbre.
3. Results
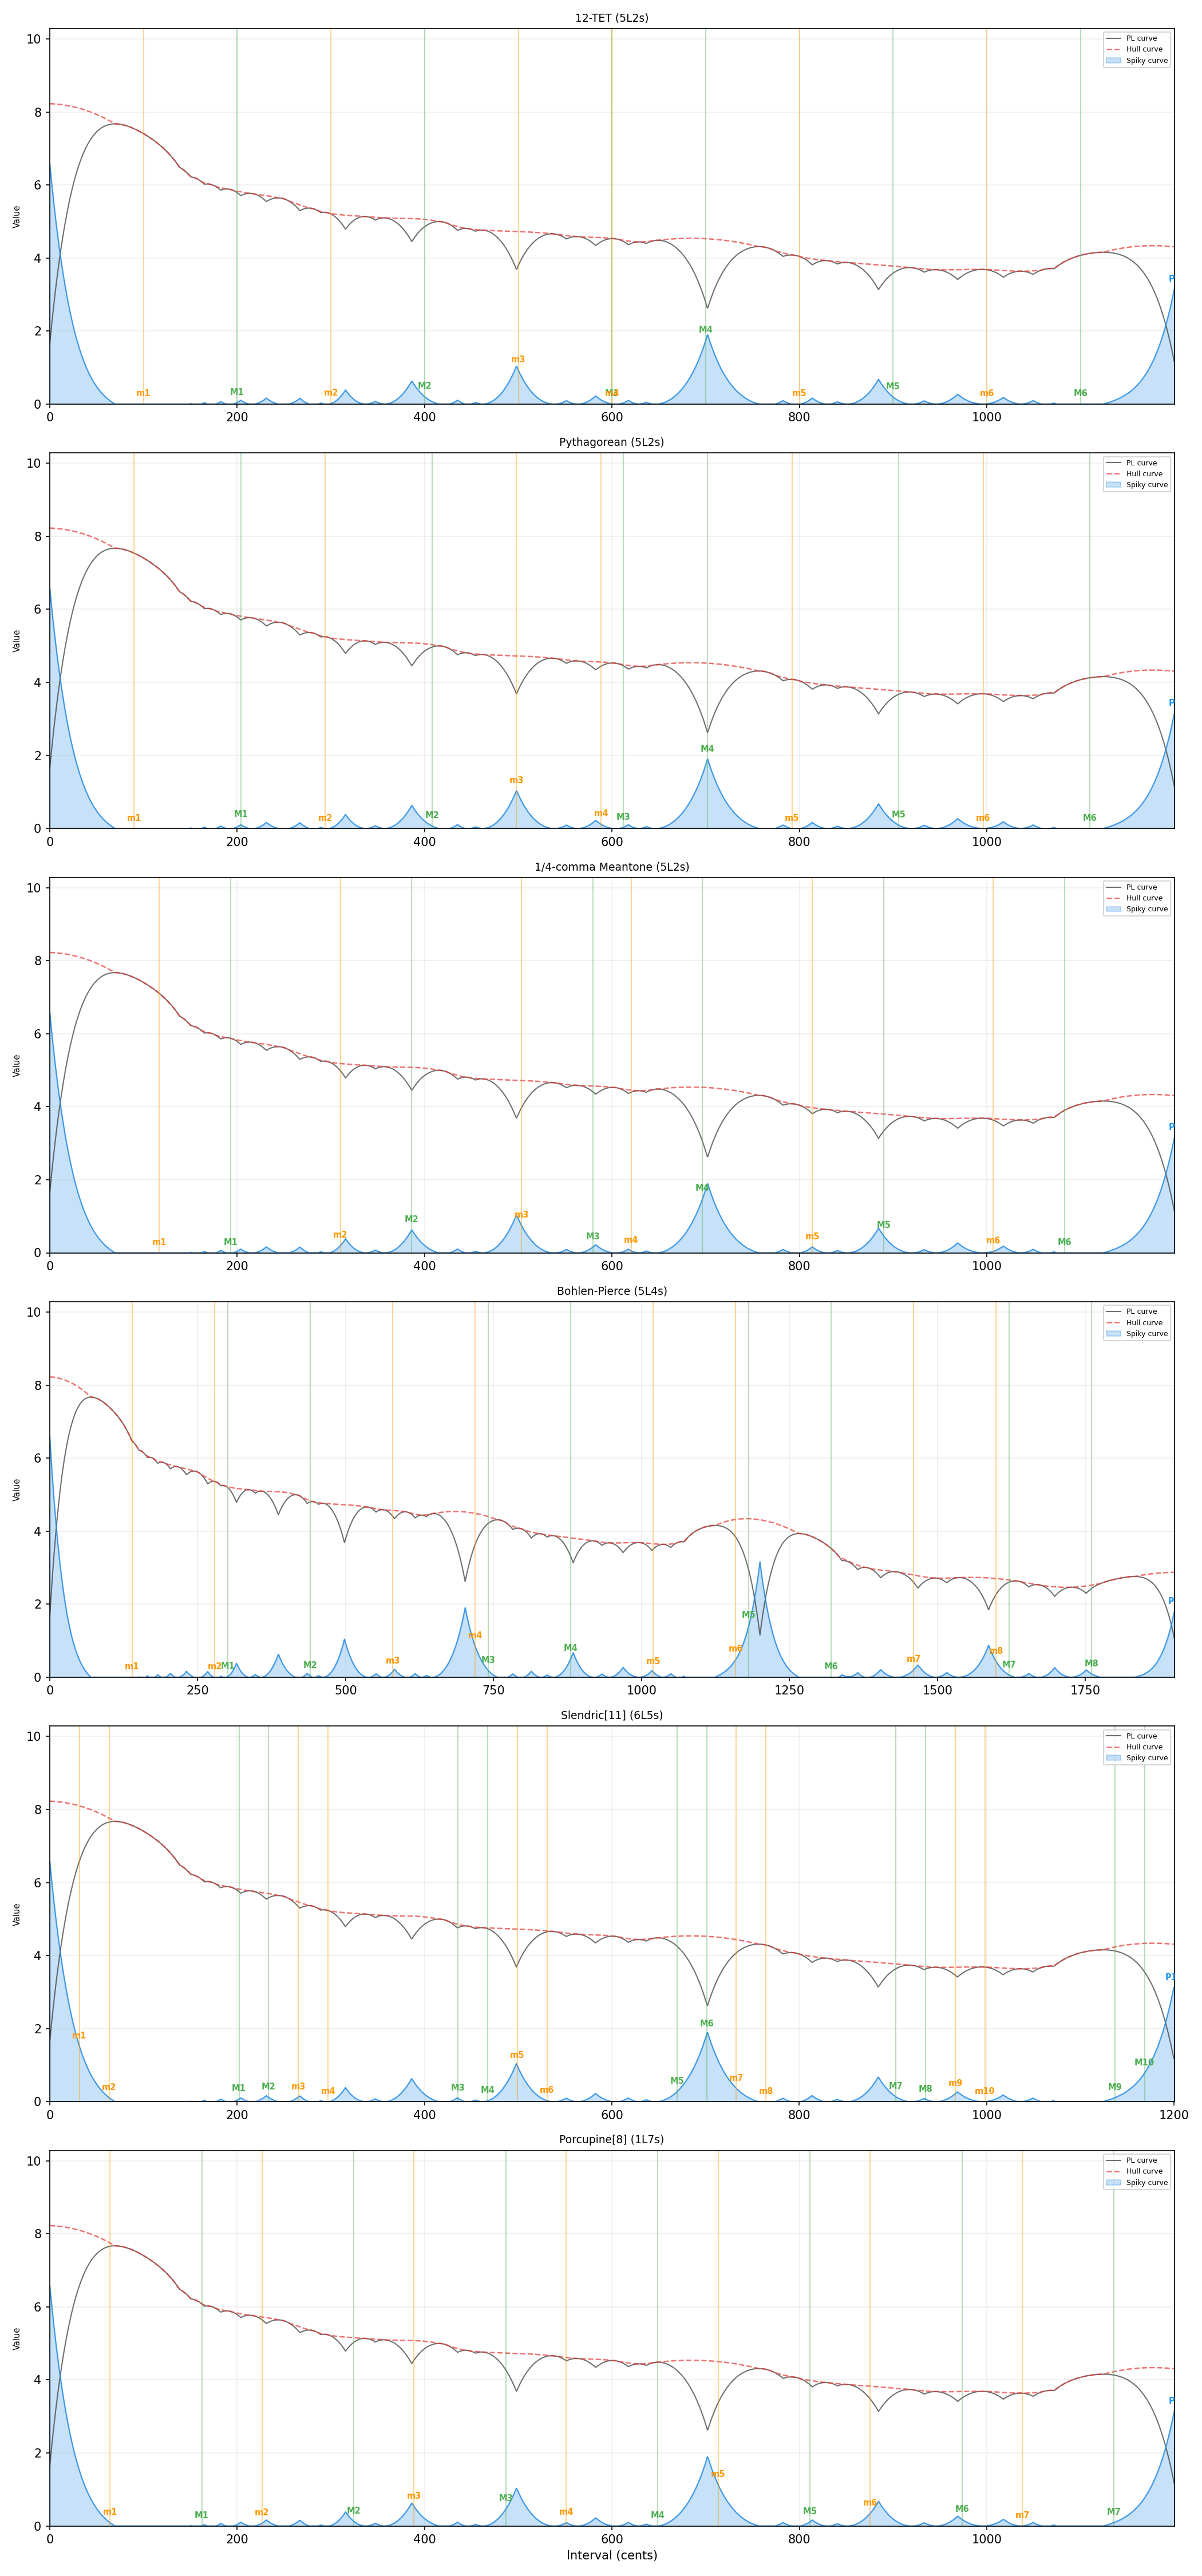
3.1 Tuning System Comparison
We computed the PitchGrid Consonance Measure for several historically important tuning systems, using a standard harmonic timbre (8 partials with 1/n amplitude decay) at f0 = 263 Hz (middle C). The following table summarizes consonance values for the diatonic intervals:
| Interval | 12-TET | Pythagorean | ¼-comma Meantone |
|---|---|---|---|
| P0 (unison) | 1.00 | 1.00 | 1.00 |
| m1 (minor second) | 0.00 | 0.00 | 0.00 |
| M1 (major second) | 0.00 | 0.00 | 0.00 |
| m2 (minor third) | 0.16 | 0.11 | 0.38 |
| M2 (major third) | 0.30 | 0.22 | 0.54 |
| m3 (perfect fourth) | 0.60 | 0.61 | 0.58 |
| M3 (augmented fourth) | 0.00 | 0.00 | 0.25 |
| m4 (diminished fifth) | 0.00 | 0.17 | 0.06 |
| M4 (perfect fifth) | 0.73 | 0.74 | 0.71 |
| m5 (minor sixth) | 0.22 | 0.18 | 0.44 |
| M5 (major sixth) | 0.12 | 0.08 | 0.31 |
| m6 (minor seventh) | 0.00 | 0.00 | 0.00 |
| M6 (major seventh) | 0.00 | 0.00 | 0.00 |
| P7 (octave) | 0.83 | 0.83 | 0.83 |
Key observations:
- The octave (P7, 0.83) and fifth (M4, 0.73–0.74) are the most consonant intervals across all tuning systems — consistent with universal musical practice.
- The Pythagorean fifth (0.74) slightly exceeds the 12-TET fifth (0.73), reflecting the just 3:2 ratio.
- Quarter-comma meantone dramatically improves thirds: M2 (major third) jumps from 0.30 (12-TET) to 0.54, reflecting the just 5:4 ratio. This comes at a small cost to M4 (fifth): 0.71 vs 0.73.
- Seconds (m1, M1) and sevenths (m6, M6) consistently receive consonance values of 0 — correctly classified as dissonant.
- The tritone region (M3/m4) is more nuanced than previously assumed: while both are 0 in 12-TET, the Pythagorean diminished fifth (m4 = 588.2¢) achieves 0.17, and the meantone augmented fourth (M3 = 579.6¢) reaches 0.25. These intervals are not interchangeable — they split apart in non-equal tunings and can be mildly consonant.
3.2 Historical Validation: The Case for Meantone
The dramatic improvement of thirds in quarter-comma meantone provides a quantitative explanation for a well-documented historical preference. Renaissance and Baroque musicians (roughly 1450–1700) widely adopted meantone temperament precisely because it produced sweeter thirds — essential for the triadic harmony that emerged in that era. Our consonance measure quantifies this: the major third's consonance nearly doubles from 0.30 to 0.54.
The eventual transition to 12-TET in the 18th–19th centuries reflects a different trade-off: equal temperament sacrifices third quality for unlimited modulation. Our measure captures both sides of this trade-off numerically.
3.3 Bohlen-Pierce Scale with Odd Harmonics
The Bohlen-Pierce (BP) scale divides the tritave (3:1 ratio, ~1902 cents) into 13 equal steps. It was designed for use with timbres containing only odd harmonics (1, 3, 5, 7, …), which naturally align with the tritave rather than the octave.
We computed the consonance measure for BP intervals using both a standard harmonic spectrum and an odd-harmonics-only spectrum:
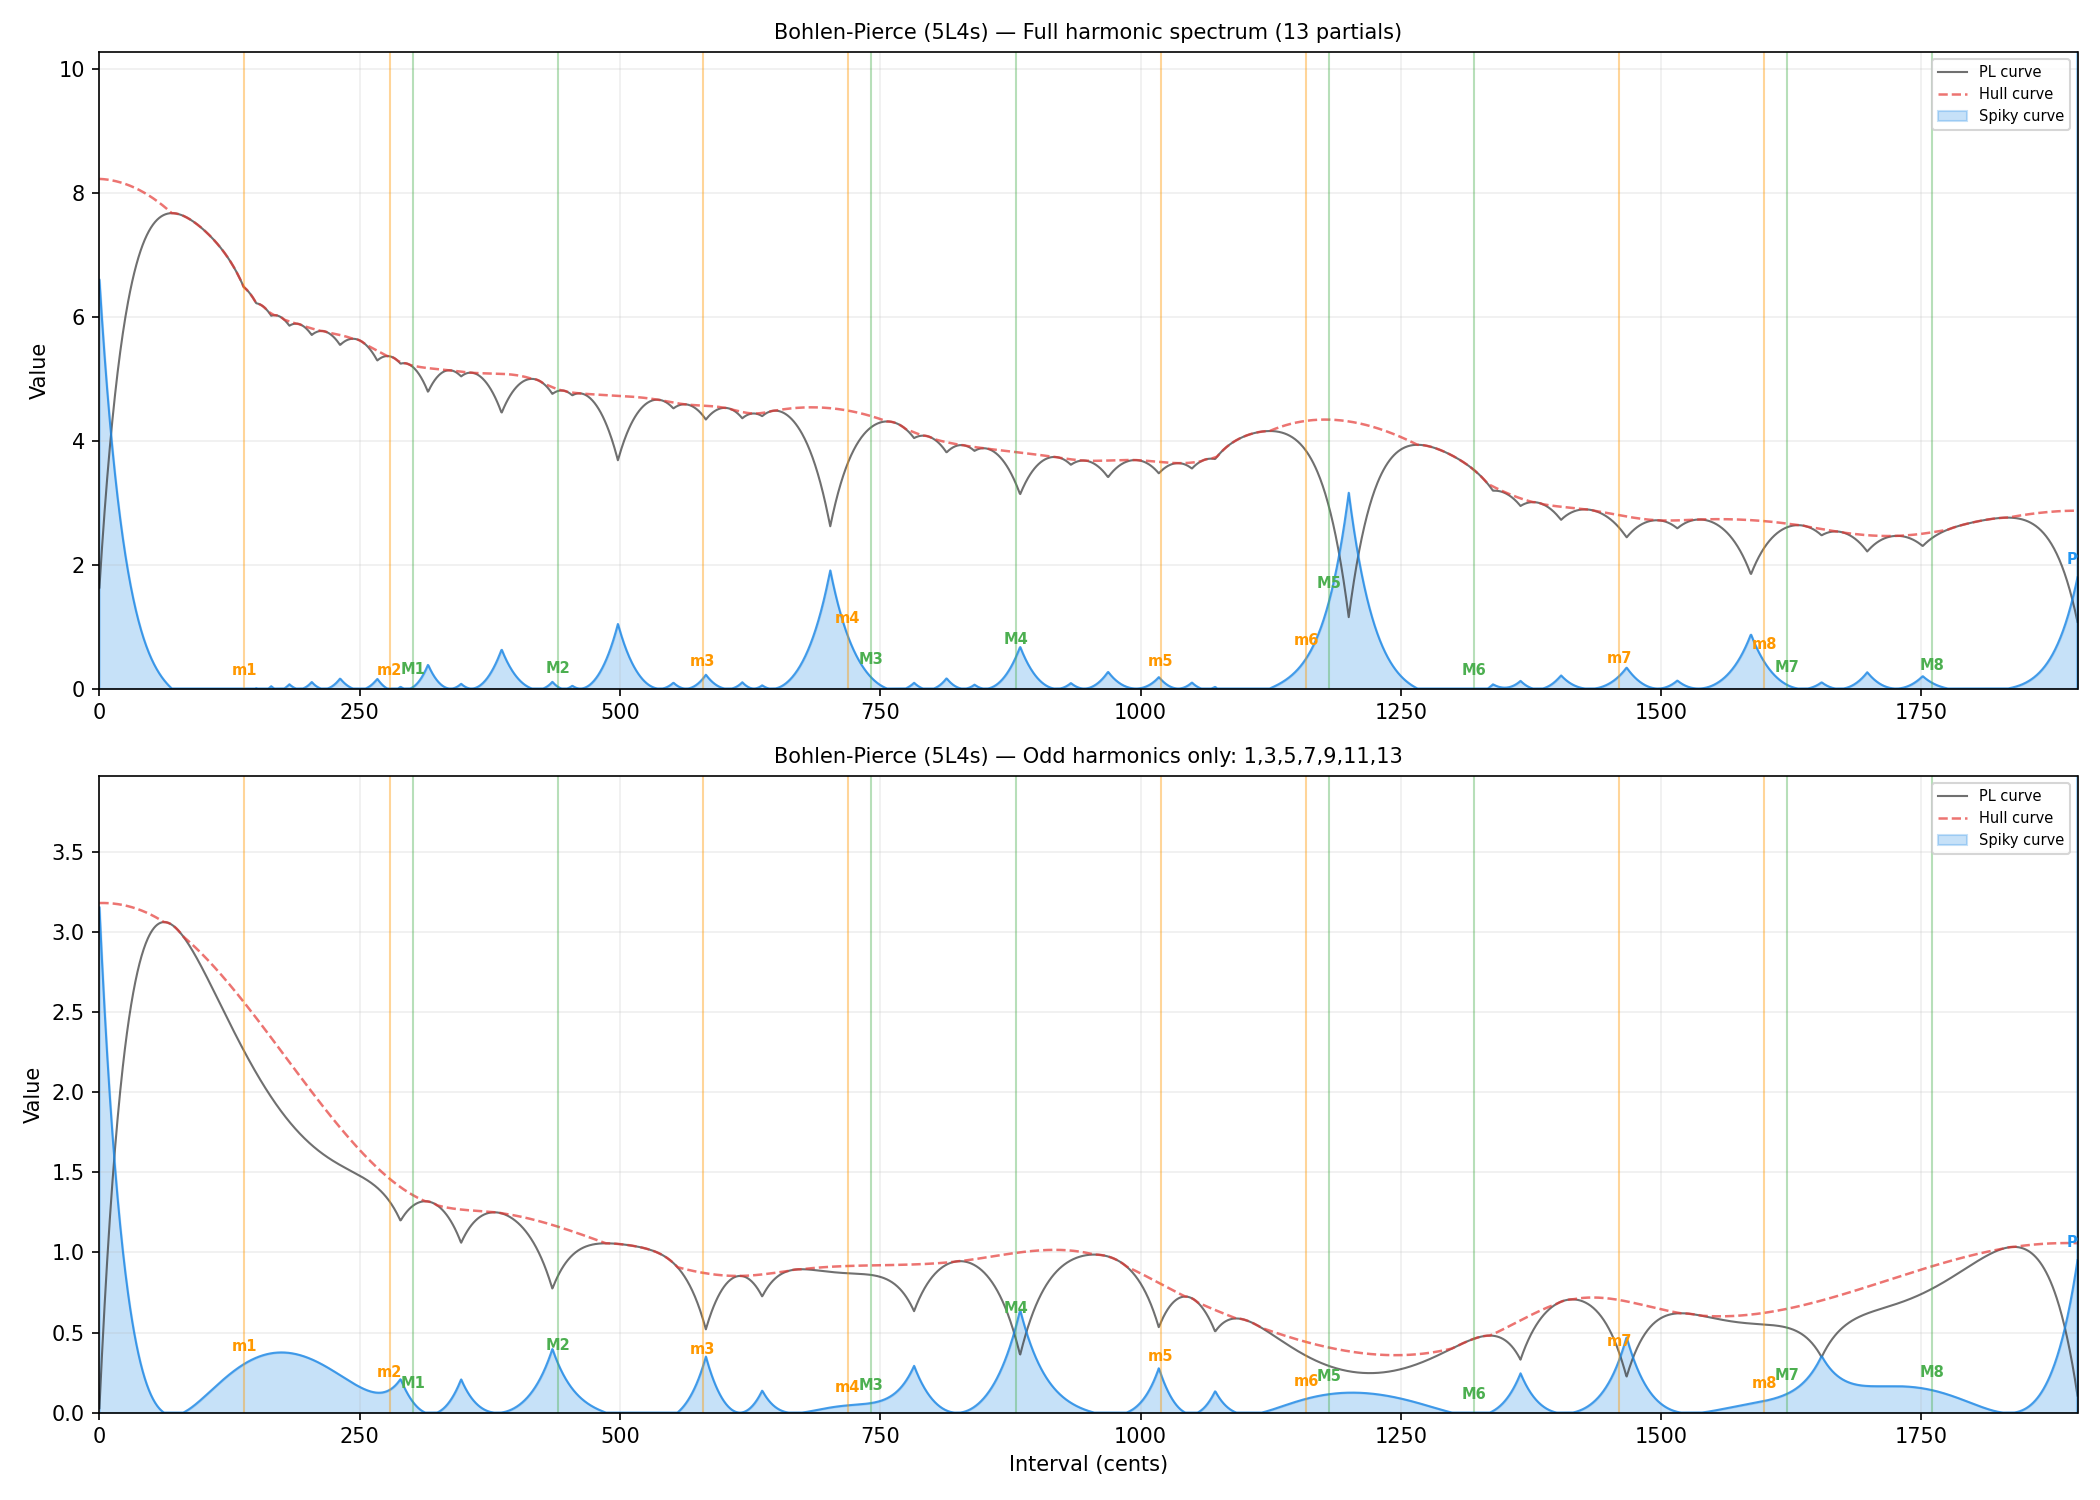
With the odd-harmonic timbre, the tritave achieves a consonance of 0.72 — comparable to the fifth in standard tuning. BP scale degrees align with spiky consonance peaks, validating the fundamental insight that consonance is a joint property of tuning and timbre.
3.4 Non-Diatonic MOS Scales: Porcupine[8] and Slendric[11]
To demonstrate the generality of the consonance measure beyond diatonic scales, we evaluate two non-diatonic MOS scales using a 13-partial harmonic spectrum (decay factor 0.88):
Porcupine[8] (1L7s) — an 8-note MOS scale with one large and seven small steps:
| Interval | Cents | Consonance |
|---|---|---|
| P0 | 0.0 | 1.00 |
| P8 | 1200.0 | 0.84 |
| m5 | 713.3 | 0.60 |
| m3 | 388.8 | 0.43 |
| M3 | 486.7 | 0.41 |
| m6 | 875.5 | 0.35 |
| M2 | 324.5 | 0.14 |
| m4 | 551.0 | 0.06 |
| m2 | 226.5 | 0.01 |
| M1 | 162.2 | 0.00 |
| M4 | 649.0 | 0.00 |
| m7 | 1037.8 | 0.00 |
Slendric[11] (6L5s) — an 11-note MOS scale with six large and five small steps:
| Interval | Cents | Consonance | Notes |
|---|---|---|---|
| P0 | 0.0 | 1.00 | |
| P11 | 1200.3 | 0.84 | |
| m1 | 31.7 | 0.72 | Near-unison: high consonance |
| M6 | 701.2 | 0.71 | ≈ just fifth (702.0¢) |
| m5 | 499.2 | 0.57 | |
| M10 | 1168.6 | 0.56 | |
| m9 | 966.6 | 0.24 | |
| m3 | 265.4 | 0.14 | |
| M2 | 233.7 | 0.11 |
Notable features: Slendric's M6 at 701.2¢ lands almost exactly on the just perfect fifth (3:2 = 702.0¢) and achieves a consonance of 0.71 — comparable to the diatonic fifth. The tiny m1 interval (31.7¢) also scores high (0.72) because it is close enough to unison that partials barely beat against each other. These results illustrate how the consonance measure applies transparently to any MOS scale, with consonance peaks emerging naturally from the interaction of tuning and timbre.
4. Parameter Studies
To understand the robustness of the measure, we examined its sensitivity to the three main spectral parameters: fundamental frequency, number of partials, and amplitude decay rate.
4.1 Varying Fundamental Frequency
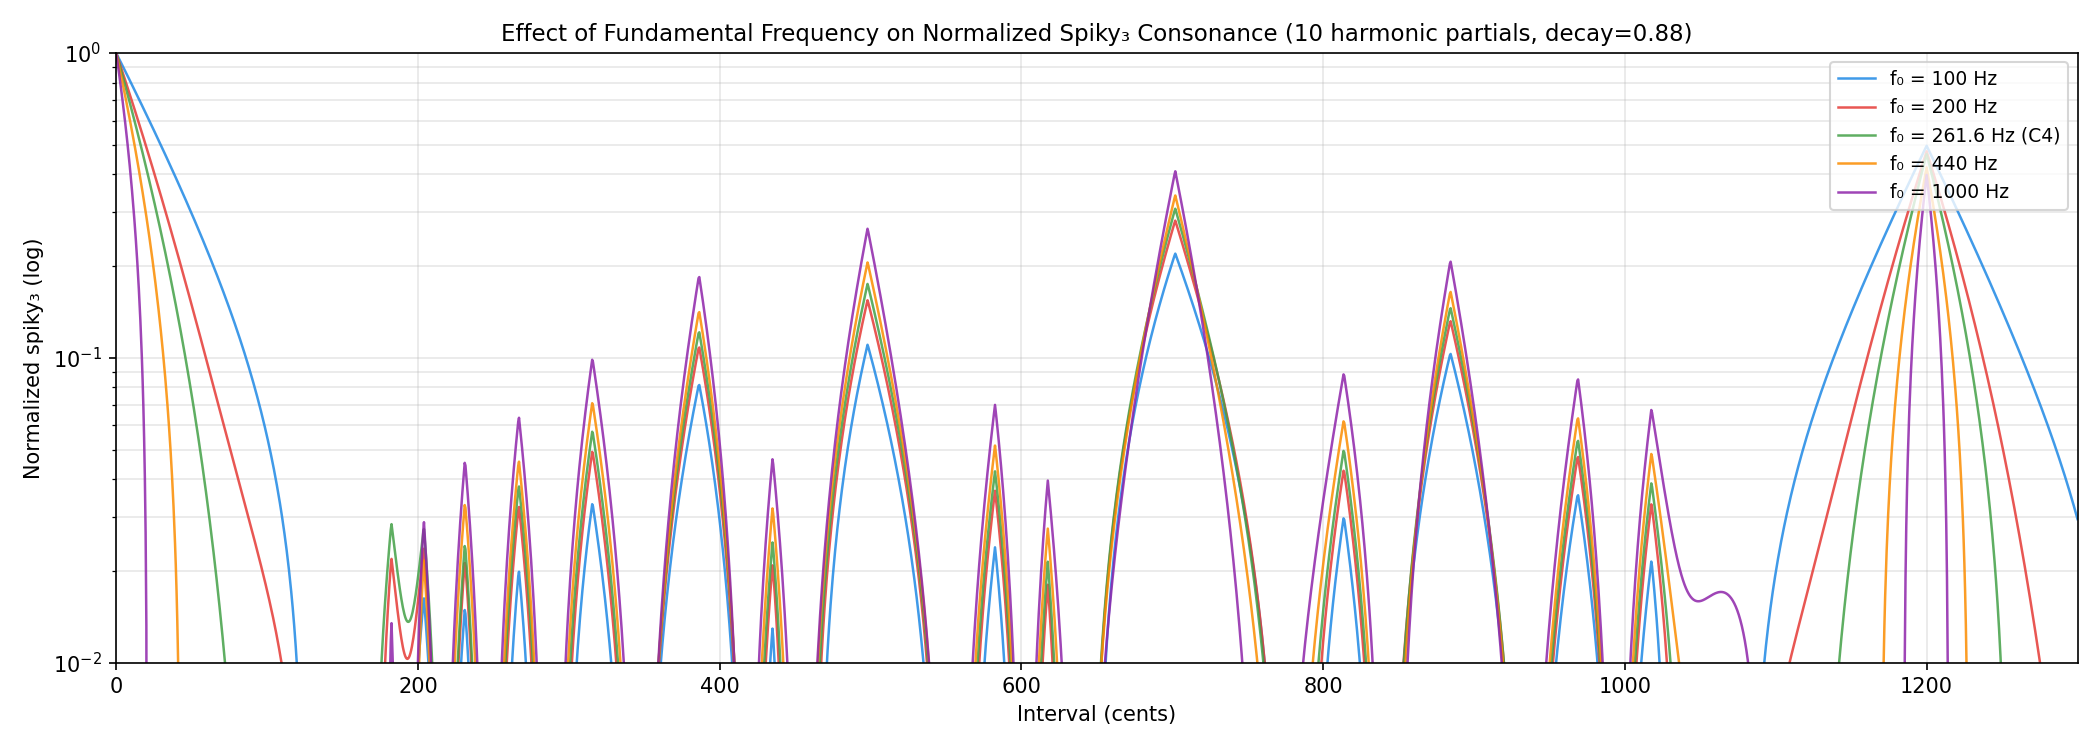
The key observation is that the consonance patterns are remarkably stable across fundamental frequencies. Consonance values calculated at one frequency are comparable to those calculated at another, with the notable exception of intervals close to unison and the octave — where deeper frequencies visibly broaden the consonance peak. It is expected that lower fundamentals widen the unison peak (critical bandwidth grows relative to the small frequency differences near unison), but it is surprising that this broadening effect does not carry over to most other just frequency ratios. The peaks at the fifth, thirds, and sixths remain largely consistent in height across the tested range.
This stability means that our consonance measure, evaluated at any reasonable fundamental frequency, will produce comparable results for the vast majority of intervals. Unless otherwise specified, all evaluations in this study use f0 = 261.6 Hz (middle C).
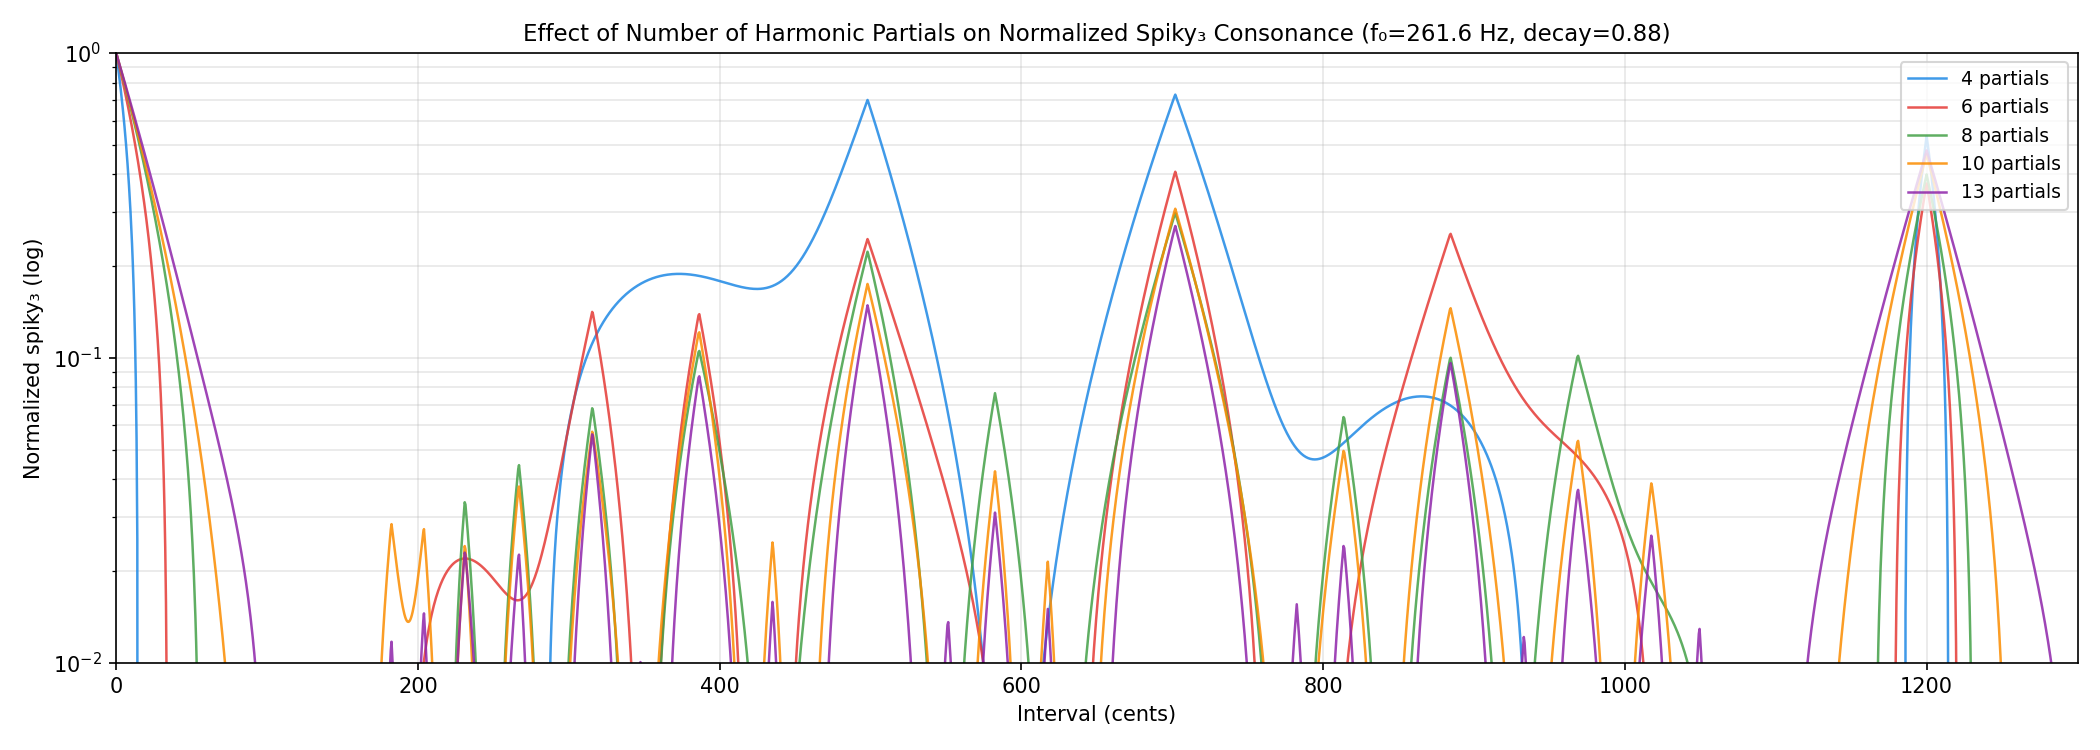
4.2 Varying Number of Partials
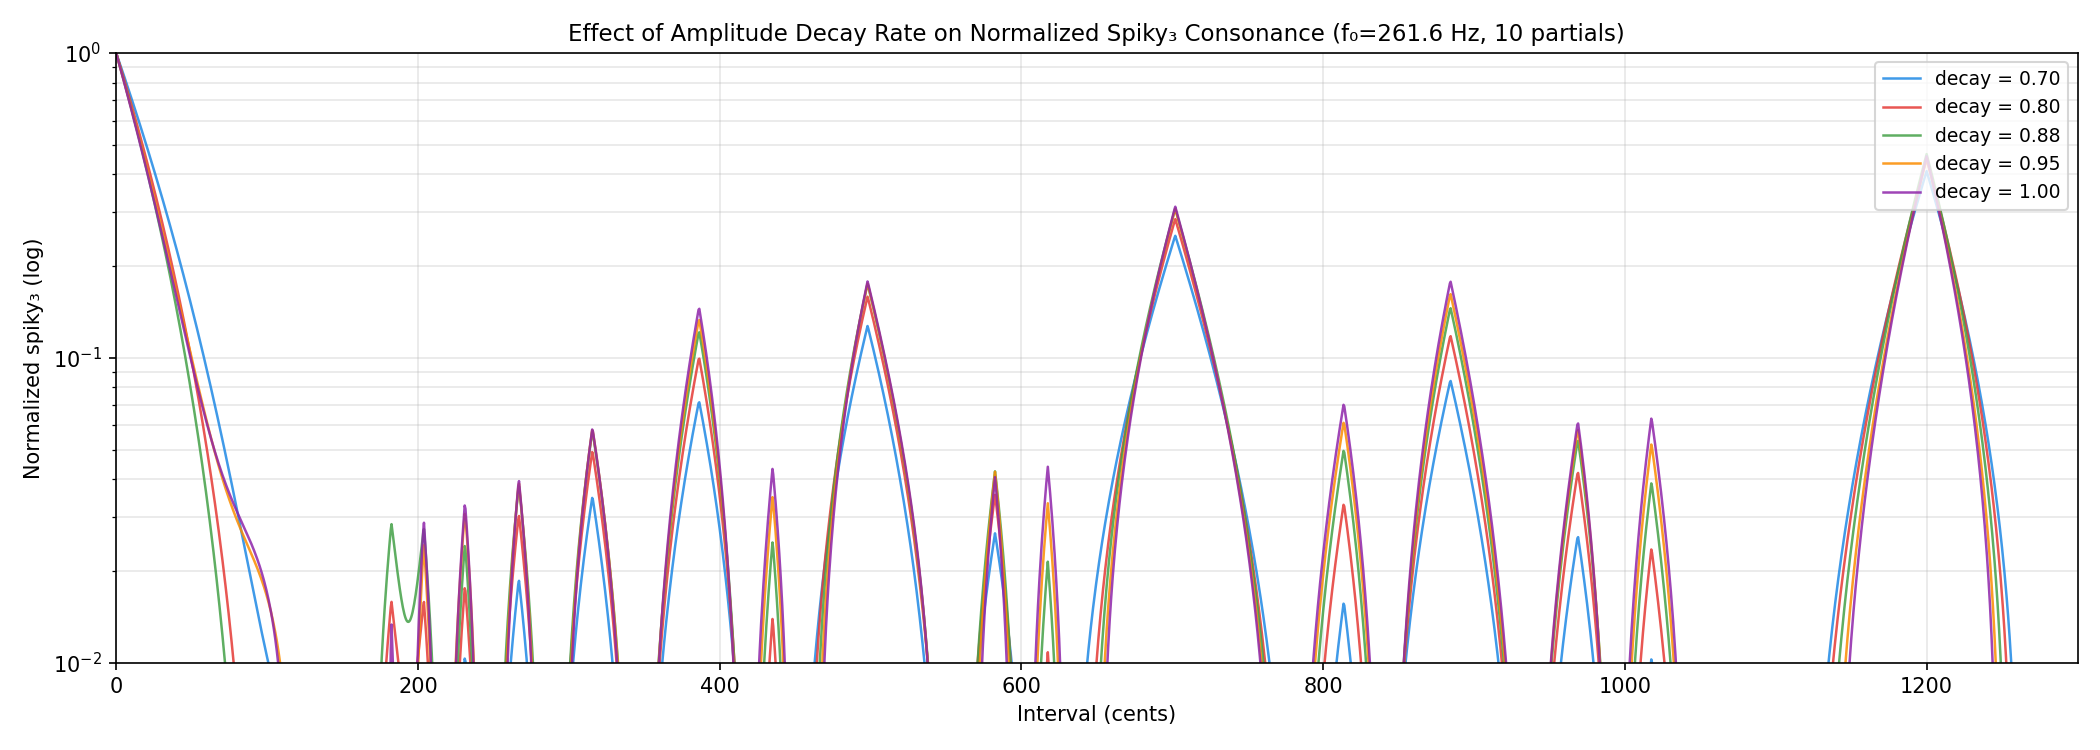
4.3 Varying Amplitude Decay
5. Discussion
5.1 The Hull Extraction: Why It Matters
The central novelty of this work is the hull extraction technique. Prior approaches to consonance based on the Plomp-Levelt model (Sethares 1993, 2005; Vassilakis 2001) work with the raw dissonance curve — identifying consonant intervals as dissonance minima. But minima of varying depth on a shifting baseline resist quantitative comparison. A shallow minimum at 400¢ might represent a "better" consonance than a deep minimum at 700¢ if the local dissonance baseline is different.
Hull extraction solves this by fitting a smooth envelope to the dissonance curve and measuring consonance as the residual — how far each interval drops below its spectral neighborhood. This is conceptually analogous to how the auditory system likely processes consonance: not as absolute roughness, but as roughness relative to expectation. The result is a measure that automatically adapts to different timbres, registers, and spectral densities without manual calibration.
To our knowledge, no prior work in the consonance/dissonance literature has applied envelope extraction to the Plomp-Levelt dissonance curve or defined consonance as a hull residual. The closest analogues exist in other fields — spectral baseline correction in analytical chemistry, trend extraction in signal processing — but the application to musical consonance appears to be new.
5.2 Timbre Dependence
The PitchGrid Consonance Measure inherits from Sethares the crucial insight that consonance is not a property of an interval alone — it is a property of the combination of interval and spectrum. What our measure adds is a way to quantify this relationship:
- Instrument design: The optimal tuning for an instrument depends on its spectrum. Metallophones and bells (inharmonic spectra) naturally favor non-standard scales — and the mean consonance score can now tell us by how much.
- Electronic music: Synthesized timbres can be designed to make any desired scale consonant. Our reverse tuning results demonstrate this quantitatively for the first time.
- Generalized music theory: Scale theory (MOS scales, regular temperaments) can be paired with consonance analysis to predict which scales will "work" for a given timbre — enabling systematic exploration of the vast space of non-diatonic tonal structures.
5.3 Relationship to Existing Measures
Several consonance measures exist in the literature: Euler's gradus suavitatis, Tenney height, harmonic entropy (Erlich), and various roughness models (Vassilakis, Harrison & Pearce). The PitchGrid measure occupies a distinct niche:
- Unlike ratio-based measures (Euler, Tenney), it applies to any interval, including irrational ones (tempered intervals), without requiring approximation by simple ratios.
- Unlike harmonic entropy (Erlich), which is a top-down information-theoretic measure of ratio ambiguity, our approach is bottom-up: derived from the physics of beating partials. The two approaches measure different aspects of consonance and are complementary.
- Unlike raw roughness models (Sethares, Vassilakis), it provides a normalized 0–1 scale through the novel hull-extraction and log-scaling steps — enabling the quantitative comparisons demonstrated in this article.
- Unlike composite models (Harrison & Pearce 2020), which combine roughness, harmonicity, and familiarity to predict chord ratings, our measure is intentionally pure — isolating the sensory component to serve as a foundation for higher-level analysis.
5.4 Limitations
The current measure is purely based on sensory (roughness) dissonance and does not account for:
- Musical context: Harmonic function, voice leading, and expectation all influence perceived consonance/dissonance in practice.
- Cultural factors: Familiarity and training affect consonance judgments.
- Virtual pitch: The perception of a missing fundamental and pattern-matching to harmonic templates is not modeled.
These are deliberate omissions, not oversights. The measure is designed to capture the sensory floor of consonance — the psychoacoustic foundation upon which musical context, cultural learning, and cognitive processing operate. A complete consonance model would integrate our measure with harmonic entropy and contextual factors, but the sensory component must be isolated and correct before it can be combined.
6. Reverse Tuning: Constructing Timbres for Scales
Traditional tuning theory asks: given the harmonic series, which scales sound most consonant? Reverse tuning inverts this question: given a scale, which timbre maximizes its consonance?
The Plomp-Levelt model depends on two inputs: the intervals of the scale and the partial frequencies of the timbre. While centuries of music theory have focused on adjusting scales to fit the harmonic series, reverse tuning adjusts the partials to fit the scale. For any tuning system, we construct a pseudoharmonic spectrum — a set of partials whose frequency ratios are derived from the scale's own intervals rather than from integer multiples of a fundamental.
For 12-TET, this means tuning the 3rd partial from its just value of 1902.0¢ to exactly 1900.0¢ (a tempered perfect twelfth), the 5th partial from 2786.3¢ to 2800.0¢ (a tempered major seventeenth), and deriving all composite partials from these adjusted primes. The result is a timbre that is acoustically native to equal temperament.
6.1 Mean Consonance Score
To compare tuning/timbre configurations with different numbers of intervals fairly, we define the mean consonance score as the average C(x) over all scale intervals from unison (0¢) up to 1950¢:
This always yields a value between 0 and 1, enabling direct comparison across tuning systems with different cardinalities.
| Configuration | Timbre | # Intervals | Mean C̄ |
|---|---|---|---|
| 12-TET (pseudoharmonic) | reverse-tuned | 22 | 0.342 |
| 1/4-comma Meantone | harmonic | 22 | 0.319 |
| Bohlen-Pierce | odd harmonics | 18 | 0.316 |
| Slendric[11] | harmonic | 35 | 0.271 |
| 12-TET | harmonic | 22 | 0.271 |
| Pythagorean | harmonic | 22 | 0.265 |
| Porcupine[8] | harmonic | 25 | 0.262 |
6.2 The Key Result
Reverse-tuned 12-TET (C̄ = 0.342) beats 1/4-comma meantone with harmonic timbre (C̄ = 0.319).
Meantone temperament was historically designed to optimize the consonance of thirds within the harmonic series. Yet by reverse-tuning the timbre to 12-TET instead, we achieve a higher mean consonance — without any compromise on the scale side. The pseudoharmonic spectrum lifts nearly every interval: minor thirds jump from C = 0.00 to 0.25, major seconds from 0.14 to 0.38, minor fifths from 0.08 to 0.40.
This suggests a paradigm shift: the optimal path to consonance may lie not in perfecting the tuning, but in adapting the timbre. For electronic and synthesized music — where timbre is freely adjustable — reverse tuning unlocks consonance in any scale, including those traditionally considered "out of tune."
6.3 Perceptual Limits of Reverse Tuning
A crucial caveat: stronger deviations from harmonicity give the timbre a metallic, bell-like quality. At some point, the human auditory system ceases to fuse the partials into a single coherent pitch and instead perceives them as distinct, separate tones. The pseudoharmonic adjustments for 12-TET are very small — the largest shift is only 13.7¢ on the 5th partial — and remain well within perceptual tolerance. For more exotic scales, however, the required deviations may become audibly unnatural.
Developing a quantitative measure of deviation from harmonicity that captures the risk of destroying timbral coherence is a key question that will be tackled in upcoming research. Such a measure would act as a constraint on reverse tuning: the pseudoharmonic spectrum must not deviate so far from the harmonic series that it loses its identity as a pitched sound.
This opens an exciting avenue: jointly optimizing tuning and timbre to maximize consonance while minimizing deviation from harmonicity. Rather than fixing one and adjusting the other, both the scale and the spectrum become free parameters in a single optimization problem — a possibility that the PitchGrid consonance framework now makes tractable.
6.4 Implications
- Any MOS scale can be made consonant by constructing a matched pseudoharmonic spectrum. This opens Porcupine, Slendric, and other non-diatonic scales to consonant harmony.
- The mean consonance score provides a single number between 0 and 1 for comparing tuning/timbre configurations, enabling systematic optimization.
- For acoustic instruments, reverse tuning is constrained by physics — but for synthesis, sampling, and physical modeling, it offers a concrete recipe for building timbres that make any scale sing.
- Joint tuning-timbre optimization, balancing consonance against timbral naturalness, is a natural next step enabled by this framework.
7. Application to Counterpoint
The consonance measure naturally defines consonance classes that can serve as the basis for generalized counterpoint rules. Using the PitchGrid Consonance Measure, we can classify intervals of any tuning system into categories analogous to the traditional:
- Perfect consonances (C > 0.6): unison, octave, fifth
- Imperfect consonances (0.2 < C ≤ 0.6): thirds, sixths (quality depends on tuning)
- Dissonances (C ≤ 0.2): seconds, sevenths; the tritone region (M3/m4) is typically dissonant but can be mildly consonant in certain tunings
This classification extends naturally to non-standard tuning systems: for the Bohlen-Pierce scale with odd harmonics, the tritave and certain BP intervals become "perfect consonances," enabling counterpoint-like composition in entirely new tonal frameworks.
8. References
- Plomp, R. & Levelt, W. J. M. (1965). "Tonal consonance and critical bandwidth." Journal of the Acoustical Society of America, 38(4), 548–560.
- Sethares, W. A. (1993). "Local consonance and the relationship between timbre and scale." Journal of the Acoustical Society of America, 94(3), 1218–1228.
- Sethares, W. A. (2005). Tuning, Timbre, Spectrum, Scale (2nd ed.). Springer.
- Helmholtz, H. von (1877/1954). On the Sensations of Tone. Dover.
- Erlich, P. (1997). "Tuning, tonality, and twenty-two-tone temperament." Xenharmonikôn, 17.
- Bohlen, H. (1978). "13 Tonstufen in der Duodezime." Acustica, 39(2), 76–86.
- Vassilakis, P. N. (2001). Perceptual and Physical Properties of Amplitude Fluctuation and their Musical Significance. PhD thesis, UCLA.
- Milne, A. J., Sethares, W. A. & Plamondon, J. (2007). "Isomorphic controllers and dynamic tuning." Computer Music Journal, 31(4), 15–32.
- Harrison, P. M. C. & Pearce, M. T. (2020). "Simultaneous consonance in music perception and composition." Psychological Review, 127(2), 216–244.
- Eerola, T. & Lahdelma, I. (2021). "The anatomy of consonance/dissonance: Evaluating acoustic and cultural predictors across multiple datasets." Music & Science, 4.
- Wilson, E. (1975). "Letter to Chalmers pertaining to Moments of Symmetry." Published at anaphoria.com.